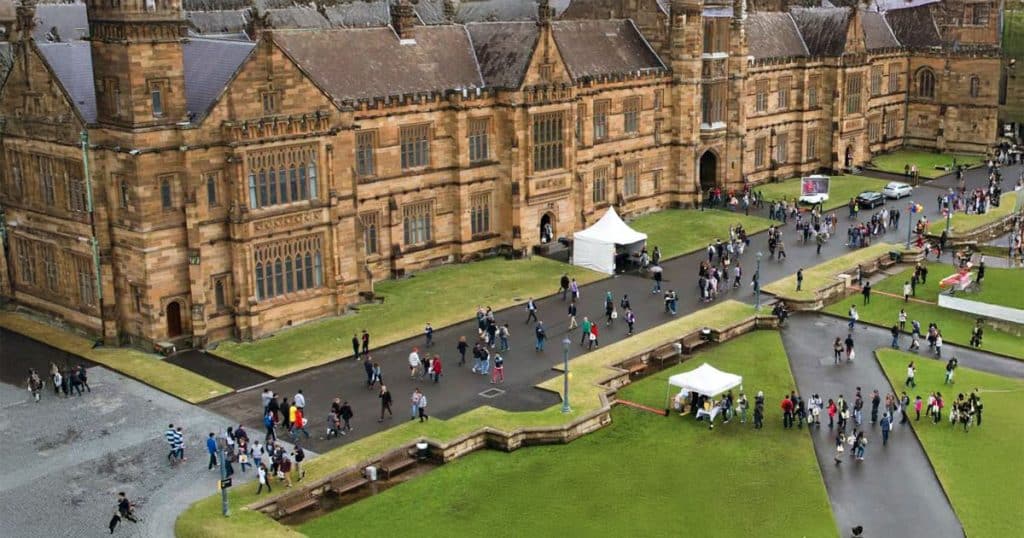
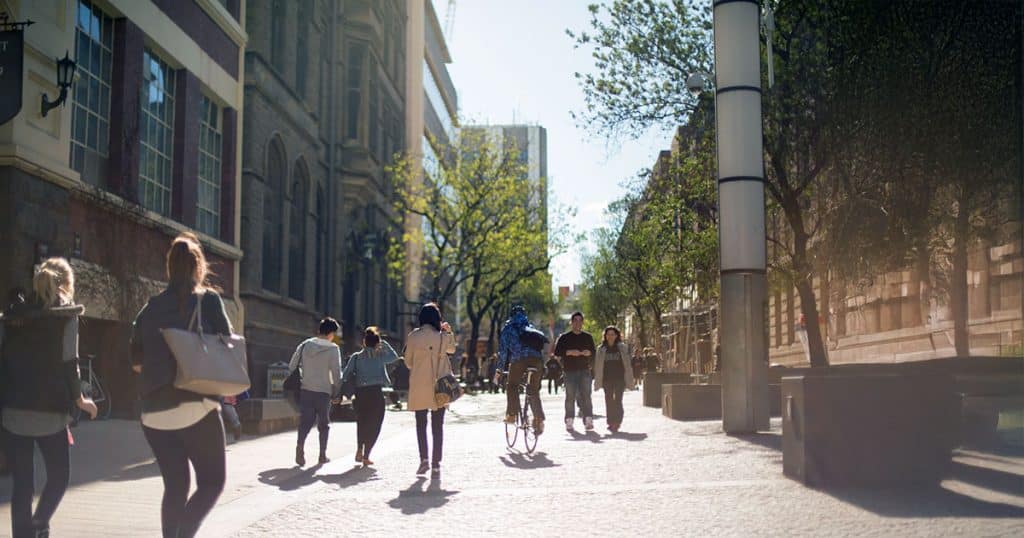
Monash is the biggest university in Australia, with 84,196 students.

Biggest Universities in Australia
| University | State | Students | International | On Campus |
|---|---|---|---|---|
| Australian Catholic University | AUS | 32,281 | 4,118 | 30,551 |
| Australian National University | ACT | 24,251 | 9,734 | 23,554 |
| Avondale University | NSW | 1,038 | 75 | 792 |
| Bond University | QLD | 5,717 | 2,219 | 5,518 |
| Charles Darwin University | NT | 13,011 | 3,439 | 6,758 |
| Charles Sturt University | NSW | 34,780 | 3,397 | 10,482 |
| CQUniversity | QLD | 21,909 | 5,172 | 13,632 |
| Curtin University | WA | 52,137 | 14,766 | 39,658 |
| Deakin University | VIC | 57,591 | 14,236 | 35,381 |
| Edith Cowan University | WA | 29,718 | 8,452 | 21,387 |
| Federation University Australia | VIC | 13,210 | 5,422 | 11,162 |
| Flinders University | SA | 26,449 | 6,970 | 21,449 |
| Griffith University | QLD | 45,521 | 9,255 | 35,043 |
| James Cook University | QLD | 20,360 | 7,857 | 16,277 |
| La Trobe University | VIC | 36,174 | 9,733 | 29,254 |
| Macquarie University | NSW | 44,217 | 10,194 | 38,405 |
| Monash University | VIC | 84,196 | 35,897 | 77,229 |
| Murdoch University | WA | 24,105 | 12,714 | 21,929 |
| QUT | QLD | 52,127 | 9,748 | 41,899 |
| RMIT University | VIC | 73,327 | 35,646 | 68,998 |
| Southern Cross University | NSW | 17,245 | 4,108 | 8,733 |
| Swinburne | VIC | 45,327 | 15,370 | 28,479 |
| Torrens University Australia | AUS | 24,833 | 11,361 | 11,596 |
| UniSQ | QLD | 21,282 | 2,367 | 7,173 |
| University of Adelaide | SA | 30,174 | 9,026 | 27,843 |
| University of Canberra | ACT | 17,147 | 4,401 | 15,506 |
| University of Divinity | VIC | 1,282 | 145 | 990 |
| University of Melbourne | VIC | 72,244 | 30,024 | 68,747 |
| University of New England | NSW | 20,123 | 1,411 | 3,023 |
| University of Newcastle | NSW | 34,119 | 5,848 | 27,828 |
| University of Notre Dame | WA | 11,381 | 581 | 11,381 |
| University of Queensland | QLD | 55,412 | 21,531 | 51,986 |
| University of South Australia | SA | 34,580 | 6,407 | 18,207 |
| University of Sydney | NSW | 76,088 | 37,528 | 72,517 |
| University of Tasmania | TAS | 31,513 | 5,441 | 14,420 |
| University of the Sunshine Coast | QLD | 17,987 | 1,921 | 15,650 |
| University of Western Australia | WA | 27,081 | 6,752 | 25,999 |
| University of Wollongong | NSW | 34,081 | 15,346 | 32,294 |
| UNSW Sydney | NSW | 70,342 | 27,735 | 62,446 |
| UTS | NSW | 47,777 | 12,925 | 43,631 |
| Victoria University | VIC | 33,292 | 14,755 | 28,346 |
| Western Sydney University | NSW | 46,609 | 10,356 | 42,113 |
| All Higher Education | AUS | 1,600,563 | 524,642 | 1,266,904 |
Monash University is the largest university in Australia, with 84,196 students. Of these, 35,897 are international students. Monash also has a strong physical presence, with 77,229 students attending on campus. Its size and international reach place it at the forefront of Australian higher education, drawing in students from around the world.
Other universities follow closely behind, including the University of Sydney with 76,088 students and RMIT with 73,327. Notably, Sydney Uni has the largest international student cohort at 37,528, despite a slightly smaller total enrolment than Monash.
Institutions like Deakin University and Swinburne have smaller on-campus figures relative to their total student population, with a focus on online education.
Biggest Uni Campus in Australia

University of Sydney - Camperdown/Darlington Campus
The Camperdown/Darlington campus is likely the largest in Australia, housing most of the University of Sydney’s 72,517 on-campus students. Given its central location and wide range of academic offerings, it could accommodate around 90% of the on-campus population, which translates to approximately 65,000 students. This makes it a contender for the top spot in terms of size and student numbers.
University of Melbourne - Parkville Campus
Parkville is the flagship campus for the University of Melbourne, with the vast majority of the 68,747 on-campus students studying here. About 85% of students are likely based at Parkville, equating to around 58,000. As the heart of Melbourne’s academic community, Parkville hosts a wide range of programs and is known for its strong research focus.
UNSW Sydney - Kensington Campus
UNSW’s Kensington campus is the main base for the university’s 62,446 on-campus students. With a broad academic offering and comprehensive facilities, approximately 90% of students could be attending this location, which would be around 56,000. Kensington is the university’s largest teaching and research facility, serving most of its faculties.
Monash University - Clayton Campus
Monash University’s Clayton campus is its largest and central hub, hosting over 52,000 students. Clayton serves all eight faculties, providing a comprehensive academic environment with advanced facilities, research centres, and vibrant student life.
University of Queensland - St Lucia Campus
The St Lucia campus at the University of Queensland is likely the primary location for most of its 51,986 on-campus students. With its large size and extensive offerings, around 90% of the students, or approximately 47,000, would attend this campus. St Lucia is a sprawling campus that supports a wide range of disciplines and research activities.
RMIT University - City Campus
RMIT’s City campus in Melbourne’s CBD hosts around 45,000 students. The campus is deeply integrated into the city, with specialised facilities for technology, design, and business studies. Its central location provides students with a dynamic urban learning experience closely connected to Melbourne’s professional landscape.
Curtin University - Bentley Campus
Curtin University's main campus in Perth (Bentley) serves as the largest base, hosting around 36,500 students. This expansive campus offers a lively academic environment with comprehensive facilities and resources. Bentley remains a key hub for both undergraduate and postgraduate programs, supported by Curtin's smaller Perth locations.
Macquarie University - North Ryde Campus
Macquarie University’s North Ryde campus in Sydney hosts most of its 38,405 on-campus students. As the university’s primary location, it likely accommodates about 90% of Macquarie’s total student body, placing around 34,000 students on-site.
Largest Schools and Faculties

The single largest school or faculty in Australia appears to be the College of Business and Law at RMIT University, with approximately 23,743 students enrolled.
Management and Commerce
Business schools offer a wide range of courses, from management to economics, and are some of the largest faculties in Australia.
- RMIT University - College of Business and Law – 21,028 undergraduate, 2,715 postgraduate
- Monash University - Faculty of Business and Economics – 13,449 undergraduate, 4,999 postgraduate
- University of Sydney - Business School – 5,595 undergraduate, 9,099 postgraduate
Society and Culture
Faculties in society and culture focus on areas such as social sciences, law, and the humanities, catering to students interested in public policy, legal studies, and cultural research.
- Macquarie University - School of Social Sciences – 10,343 undergraduate, 1,532 postgraduate
- Monash University - School of Social Sciences – 8,740 undergraduate, 3,866 postgraduate
- University of Melbourne - School of Social and Political Sciences – 7,579 undergraduate, 6,511 postgraduate
Engineering
Engineering faculties train future engineers in fields such as civil, mechanical, and electrical engineering.
- RMIT University - School of Engineering – 8,506 undergraduate, 1,773 postgraduate
- UNSW - School of Engineering – 6,282 undergraduate, 3,896 postgraduate
- Monash University - Faculty of Engineering – 7,275 undergraduate, 1,443 postgraduate
Computer Science
Information technology faculties are growing rapidly, focusing on disciplines such as artificial intelligence, computing, software engineering, and data science.
- Monash University - Faculty of Information Technology – 4,017 undergraduate, 3,067 postgraduate
- RMIT University - School of Computing Technologies – 4,265 undergraduate, 1,615 postgraduate
- UTS - School of Computer Science – 3,699 undergraduate, 1,819 postgraduate